Signal processing relies heavily on convolution and correlation to analyze and manipulate signals. This guide is designed for students and engineers who want clear explanations, MATLAB code, and guided practice questions—all structured for readability and practical application.
Introduction
In signal processing:
- Convolution determines how a system responds to an input signal.
- Correlation measures similarity between signals.
MATLAB provides efficient built-in functions:
conv()→ for convolutionxcorr()→ for correlation
Discrete-Time Convolution
Concept
Discrete convolution is defined as:
It involves flipping and shifting one signal, then summing the product.
MATLAB Example 1 (Basic)
% Discrete-Time Convolution Example

clc;
clear;
close all;

% Define signals
x = [1 2 3 4];
h = [1 1 1];

% Perform convolution
y = conv(x, h);

% Display results
disp('x(n) = '); disp(x);
disp('h(n) = '); disp(h);
disp('y(n) = '); disp(y);

% Plot
figure;
subplot(3,1,1); stem(x, 'filled'); title('x(n)');
subplot(3,1,2); stem(h, 'filled'); title('h(n)');
subplot(3,1,3); stem(y, 'filled'); title('y(n) = x(n)*h(n)');
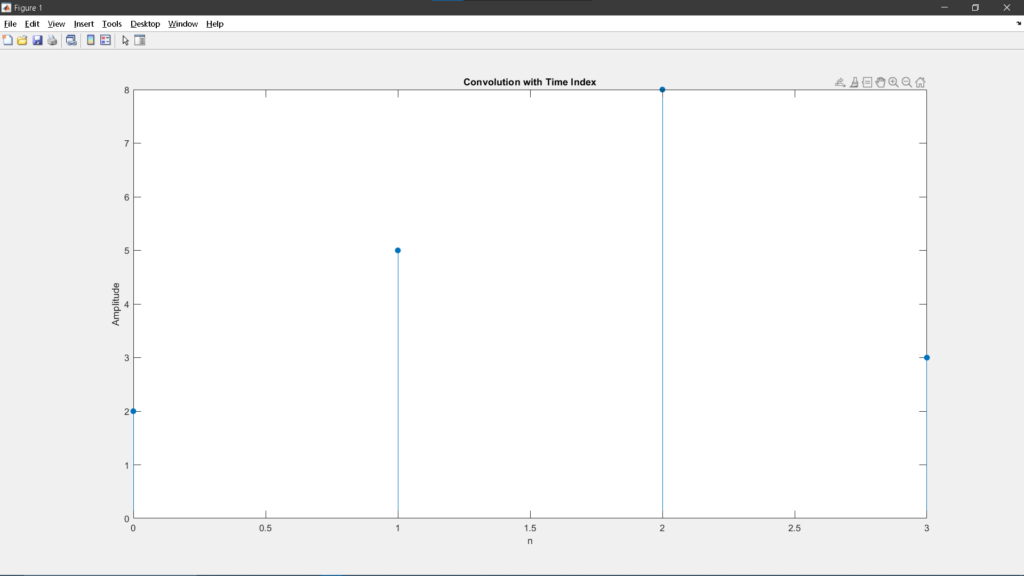
MATLAB Example 2 (With Time Index)
% Convolution with time indexing

x = [1 2 3];
nx = 0:2;

h = [2 1];
nh = 0:1;

y = conv(x, h);
ny = (nx(1)+nh(1)):(nx(end)+nh(end));

stem(ny, y, 'filled');
title('Convolution with Time Index');
xlabel('n');
ylabel('Amplitude');
Discrete-Time Correlation
Concept
Correlation measures similarity:
Terms
In the formula above.
- – shows how similar the two signals are
- x[k] – the first signal
- y[k+n] – the second signal (shifted)
- k – index used for adding values
- n – amount of shift (lag)
In simple terms, you shift one signal, multiply it with the other, and add the results to measure similarity.
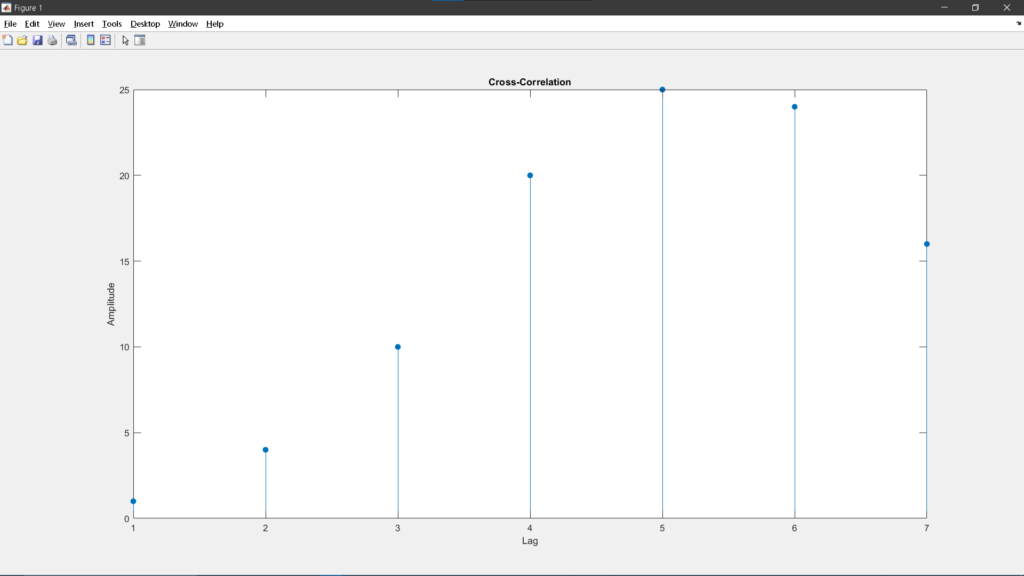
MATLAB Example 1
% Discrete Correlation Example

clc;
clear;
close all;

x = [1 2 3 4];
y = [4 3 2 1];

r = xcorr(x, y);

disp('Correlation result:');
disp(r);

stem(r, 'filled');
title('Cross-Correlation');
xlabel('Lag');
ylabel('Amplitude');
MATLAB Example 2 (Auto-correlation)
% Auto-correlation

x = [1 2 3 4];

r = xcorr(x, x);

stem(r, 'filled');
title('Auto-correlation of x(n)');
xlabel('Lag');
ylabel('Amplitude');
Continuous-Time Signals in MATLAB (Approximation)
MATLAB works in discrete samples, so continuous signals are approximated using high-resolution sampling.
Example 1: Continuous Convolution
% Continuous-Time Approximation using sampling

clc;
clear;
close all;

t = -5:0.01:5;

x = exp(-t) .* (t >= 0);   % exponential signal
h = ones(size(t));         % unit step approx

dt = t(2) - t(1);

y = conv(x, h) * dt;

ty = linspace(t(1)+t(1), t(end)+t(end), length(y));

plot(ty, y);
title('Continuous-Time Convolution (Approx)');
xlabel('Time');
ylabel('Amplitude');
Example 2: Continuous Correlation
% Continuous Correlation Approximation

t = -5:0.01:5;

x = sin(t);
y = cos(t);

r = xcorr(x, y);

plot(r);
title('Continuous-Time Correlation (Approx)');
Additional Practical Examples
Example: Moving Average Filter (Convolution)
% Moving average filter

x = [3 5 7 9 11];
h = (1/3)*[1 1 1];

y = conv(x, h);

stem(y, 'filled');
title('Moving Average Filter Output');
Example: Signal Detection (Correlation)
% Detect pattern using correlation

signal = [0 0 1 2 3 2 1 0];
pattern = [1 2 3];

r = xcorr(signal, pattern);

stem(r, 'filled');
title('Pattern Detection using Correlation');
Guide Questions (Practice Section)
Use these to test your understanding:
Conceptual Questions
- What is the main difference between convolution and correlation?
- Why is one signal flipped in convolution but not in correlation?
- How does convolution relate to LTI systems?
MATLAB Practice Tasks
- Modify the input signal in the convolution example to
[2 4 6 8]. What changes? - Create two sinusoidal signals with different frequencies and compute their correlation.
- Implement convolution manually using a
forloop instead ofconv(). - Compare results of
conv()and your manual implementation. - Increase sampling resolution (
dt) in continuous approximation. What happens to accuracy?
Challenge Problem
- Generate a noisy signal and use correlation to detect a hidden pattern inside it.
Key Differences Summary
| Feature | Convolution | Correlation |
|---|---|---|
| Purpose | System response | Similarity detection |
| Time reversal | Yes | No |
| MATLAB Function | conv() | xcorr() |
Importance in Electronics and Computer Engineering
Convolution and correlation are not just theoretical tools—they are core building blocks in modern engineering systems.
In Electronics Engineering
- Used in digital filter design (low-pass, high-pass, band-pass filters)
- Essential for signal reconstruction and noise reduction
- Applied in control systems to determine system response
In Computer Engineering
- Fundamental in digital signal processing (DSP) algorithms
- Used in image processing, including blurring, sharpening, and edge detection
- Plays a key role in machine learning and pattern recognition
- Applied in communications systems for signal detection and synchronization
These operations form the backbone of systems found in:
- Smartphones
- Audio and video processing systems
- Radar and communication devices
- Embedded and real-time systems
Conclusion
Convolution and correlation are essential operations that enable engineers to analyze, design, and optimize signal-based systems. With MATLAB, implementing these concepts becomes efficient and intuitive through built-in functions and visualization tools.
A strong grasp of these topics allows for deeper understanding of system behavior, improved signal analysis, and practical implementation across a wide range of engineering applications.
Karl Ivan T. Soriano
Conceptual Questions
MATLAB Practice Tasks
Challenge Problem
t = 0:0.001:1;
pattern = sin(2*pi*10*t(1:100)); % short sinusoidal pattern
noise = randn(1,1000); % noisy signal
signal = noise;
signal(400:499) = signal(400:499) + pattern; % embed pattern
corr_result = xcorr(signal, pattern);
plot(corr_result);
Conceptual Questions
1.What is the main difference between convolution and correlation?
-While convolution is a mathematical tool used to determine the output of a system by combining an input signal with an impulse response, correlation is a measure of similarity used to identify patterns or signal matches at various time lags.
2.Why is one signal flipped in convolution but not in correlation?
-One signal is flipped in convolution to maintain the correct chronological order of cause and effect (causality), whereas correlation does not require a flip because it simply performs a sliding comparison to see how well two waveforms align.
3.How does convolution relate to LTI systems?
-For any Linear Time-Invariant (LTI) system, the output is mathematically defined as the convolution of the input signal and the system’s unique impulse response, meaning the system effectively “convolves” any incoming data to produce a result.
Practice tasks
1.Modify the input signal in the convolution example to [2 4 6 8]. What changes?
-The output signal amplitude increases and the resulting waveform expands to reflect the weighted sum of the [2 4 6 8] sequence as it interacts with the second signal.
2.Create two sinusoidal signals with different frequencies and compute their correlation.
-Computing the correlation of two sinusoids with different frequencies yields a value near zero because the signals are orthogonal, meaning their varying phases cause their products to cancel out over time.
3.Implement convolution manually using a for loop instead of conv().
-Manually implementing convolution with a for loop requires calculating the sum of products for every shift of the input signal relative to the impulse response.
4.Compare results of conv() and your manual implementation.
-Comparing the results shows that the manual implementation and the conv() function produce identical numerical arrays, though the built-in function is significantly faster due to optimized internal algorithms.
5.Increase sampling resolution (dt) in continuous approximation. What happens to accuracy?
-Increasing the sampling resolution by using a smaller dt improves accuracy because the discrete points more closely mimic a continuous waveform, reducing approximation errors during the convolution process.
Challenge Problem
Generate a noisy signal and use correlation to detect a hidden pattern inside it.
fs = 1000;
t = 0:1/fs:1;
template = sin(2*pi*50*t(1:100)); % 0.1s sine pulse
target_start = 400;
signal = zeros(1, length(t));
signal(target_start : target_start+99) = template;
noisy_signal = signal + 2*randn(1, length(t));
[correlation, lags] = xcorr(noisy_signal, template);
[~, max_idx] = max(correlation);
detected_lag = lags(max_idx);
subplot(2,1,1);
plot(noisy_signal); title(‘Noisy Signal (Hidden Pattern)’);
subplot(2,1,2);
plot(lags, correlation); title(‘Cross-correlation Result’);
grid on;
Darlene Joyce V. Taguibao
Conceptual Questions
1. Convolution is used to determine the output of a system given input and an impulse response .It involves time – reversal or flipping one signal while Correlation is used to measure the similarity between two signals. It does not involve flipping any signal.
2. In Convolution , flipping is a necessity for LTI systems. it ensures the input and the system’s response are correctly aligned in time so that the output follows the laws of physics (causality).Meanwhile , Correlation It is simply a similarity test. You are just sliding one signal over another to see where they match best, so flipping isn’t required.
3. Convolution is the fundamental mathematical tool used to describe LTI systems. If you know the impulse response h(n) of a system, you can find the output y(n)for any input x(n) using the convolution sum.
MATLAB Practice Tasks
1. Modify the input signal in the convolution example to [2 4 6 8]. What changes?
The output becomes more shorter when the input signal is changed because the signal length is reduced.When the values are smaller in magnitude ,the overall behavior still remains the same.
2. Create two sinusoidal signals with different frequencies and compute their correlation.
The final output shows two unaligned signal. Since the two sine waves are vibrating at different speeds, they never really find a rhythm together, resulting in a low-amplitude, wavy line that stays close to zero.Instead, small ripples or “beating” patterns are shown where the waves briefly line up before falling back out of sync. This flat, oscillating result is the mathematical way of saying the two signals aren’t a match.
3. Implement convolution manually using a for loop instead of conv().
Example:
% Define the input signals
x = [2 4 6 8]; % Input signal from Task 1
h = [1 1 1]; % Example impulse response
% Determine lengths
Lx = length(x);
Lh = length(h);
Ly = Lx + Lh – 1; % Length of the output signal
% Initialize the output with zeros
y_manual = zeros(1, Ly);
% Manual Convolution using nested for loops
for n = 1:Ly
for k = 1:Lh
% The ‘if’ condition ensures we only stay within the bounds of signal x
if (n – k + 1) > 0 && (n – k + 1) <= Lx
y_manual(n) = y_manual(n) + h(k) * x(n – k + 1);
end
end
end
% Display the result
disp(‘Manual Convolution Result:’);
disp(y_manual);
The final output is a sequence of numbers that represents the “smeared” or filtered version of the original input signal. By manually sliding, multiplying, and summing the overlapping parts of the two signals through a loop, it got to produce a resulting array that is longer than the originals—specifically the length of both signals combined minus one. This array shows exactly how the system response evolves over time, and it should perfectly match the result of the built-in conv() function.
4. Compare results of conv() and your manual implementation.
Both the built-in conv() function and the manual “for loop” implementation produce the exact same sequence. This identical output proves that the manual process of sliding, multiplying, and summing correctly replicates the standard convolution algorithm. Furthermore, the resulting length confirms the mathematical rule that the output signal length equals the sum of the input lengths minus one ).
5. Increase sampling resolution (dt) in continuous approximation. What happens to accuracy?
Increasing the sampling resolution—which involves making the time step (dt) smaller—significantly improves the accuracy of a continuous approximation. As dt decreases, the discrete samples more closely resemble the original continuous waveform, reducing the “gaps” between points and minimizing approximation errors like aliasing.
Challenge Problem
Generate a noisy signal and use correlation to detect a hidden pattern inside it
% Pattern Detection via Cross-Correlation
clc; clear; close all;
fs = 1000;
t_pat = 0:1/fs:0.1;
pattern = chirp(t_pat, 20, t_pat(end), 120);
pattern = pattern / max(abs(pattern));
% Embed pattern in noise at two locations
sig = randn(1, 3000);
for loc = [500, 2100]
sig(loc:loc+length(pattern)-1) = sig(loc:loc+length(pattern)-1) + 3*pattern;
end
% Cross-correlate and detect peaks
[rxy, lags] = xcorr(sig, pattern);
rxy_norm = abs(rxy) / max(abs(rxy));
[~, peaks] = findpeaks(rxy_norm, lags, ‘MinPeakHeight’, 0.5, …
‘MinPeakDistance’, length(pattern));
fprintf(‘Detected at: %s seconds\n’, num2str(peaks/fs));
% Plot
t = (0:2999)/fs;
subplot(3,1,1); plot(t_pat*1000, pattern); title(‘Template’); xlabel(‘ms’);
subplot(3,1,2); plot(t, sig); xline([500,2100]/fs,’r–‘); title(‘Noisy Signal’); xlabel(‘s’);
subplot(3,1,3); plot(lags/fs, rxy_norm); yline(0.5,’k–‘); title(‘Cross-Correlation’); xlabel(‘lag (s)’);
sgtitle(‘Cross-Correlation Pattern Detection’);